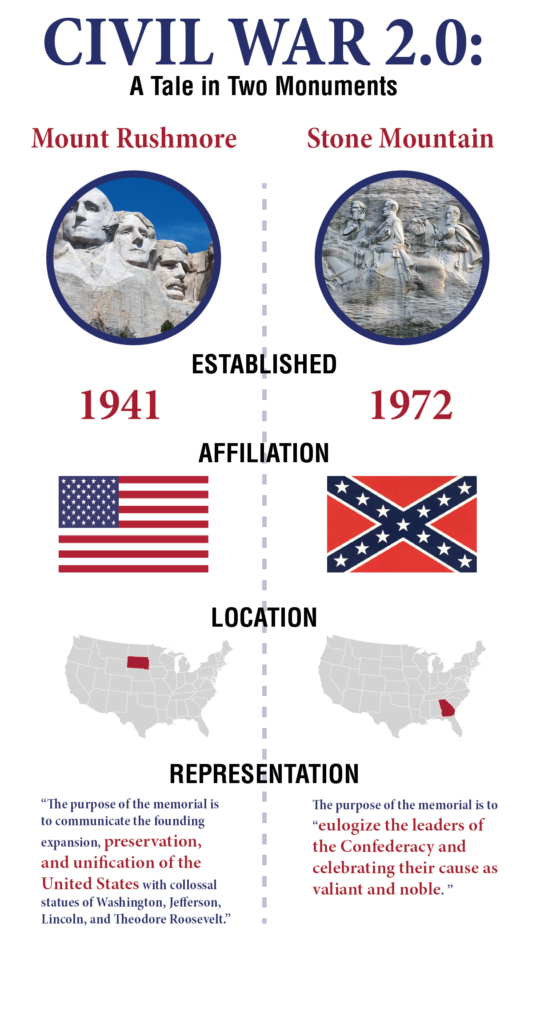
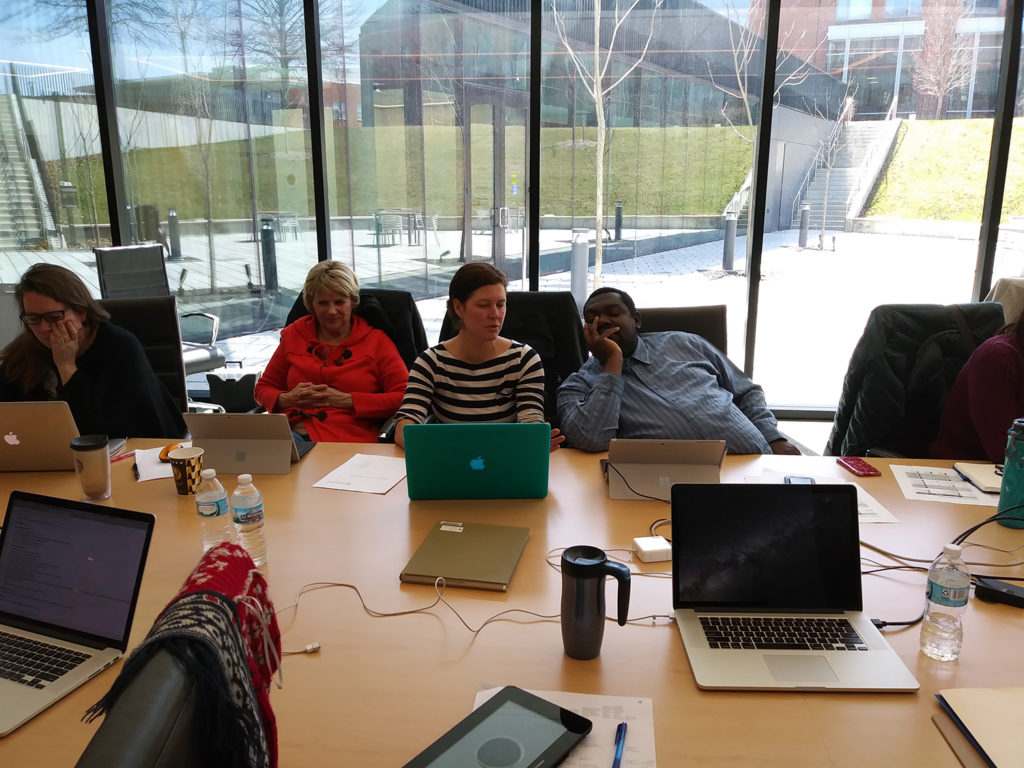
This week I co-taught a workshop for Webster humanities faculty about information graphics, specifically how to make them with Adobe Illustrator and how the creation of information graphics could be an alternative assignment to the more traditional research paper. This is a great assignment for students because the creation of information graphics:
- allows students to be creative
- requires deeper engagement, making tangible
- causes students to question / challenge assumptions
- is about making something new that has value to them or the community
The goal of the workshop was to help faculty better understand what infographics are, how they are made and what tools are used within the Adobe Creative Cloud. Each faculty team was given some article about the civil war and how it is perceived in the present day. Then, with the help of their software/design expert (me and my students), each of the teams created an infographic. For less than 1 hour of work – the faculty attendees were pretty impressed with what we were able to do.
One of the most rewarding parts of the day for me was to see my students shine and show off their design and technical skills. They demonstrated their abilities to think visually and clearly communicate some of the most interesting aspects of the material that was given to them.
While no faculty member walked away as an expert in design or Adobe software, their eyes were opened to new possibilities.


